s.png)
Dichromacy 2
since June 14, 2025
For some images, click them, then larger images will appear.
C型の人には「56」に見えて、P型の人には「93」に見える画像
An image that appears as '56' to people with trichromacy and as '93' to people with protanopia
Copyright Akiyoshi Kitaoka 2025 (June 14)
s.png)
C型の人には「12」に見えて、D型の人には「71」に見える画像
An image that appears as '12' to people with trichromacy and as '71' to people with protanopia
Copyright Akiyoshi Kitaoka 2025 (June 15)
上図の画像は、C型でも「1」に見える人がいるとのことで、下記修正版を作りました。<June 18, 2025>
s.png)
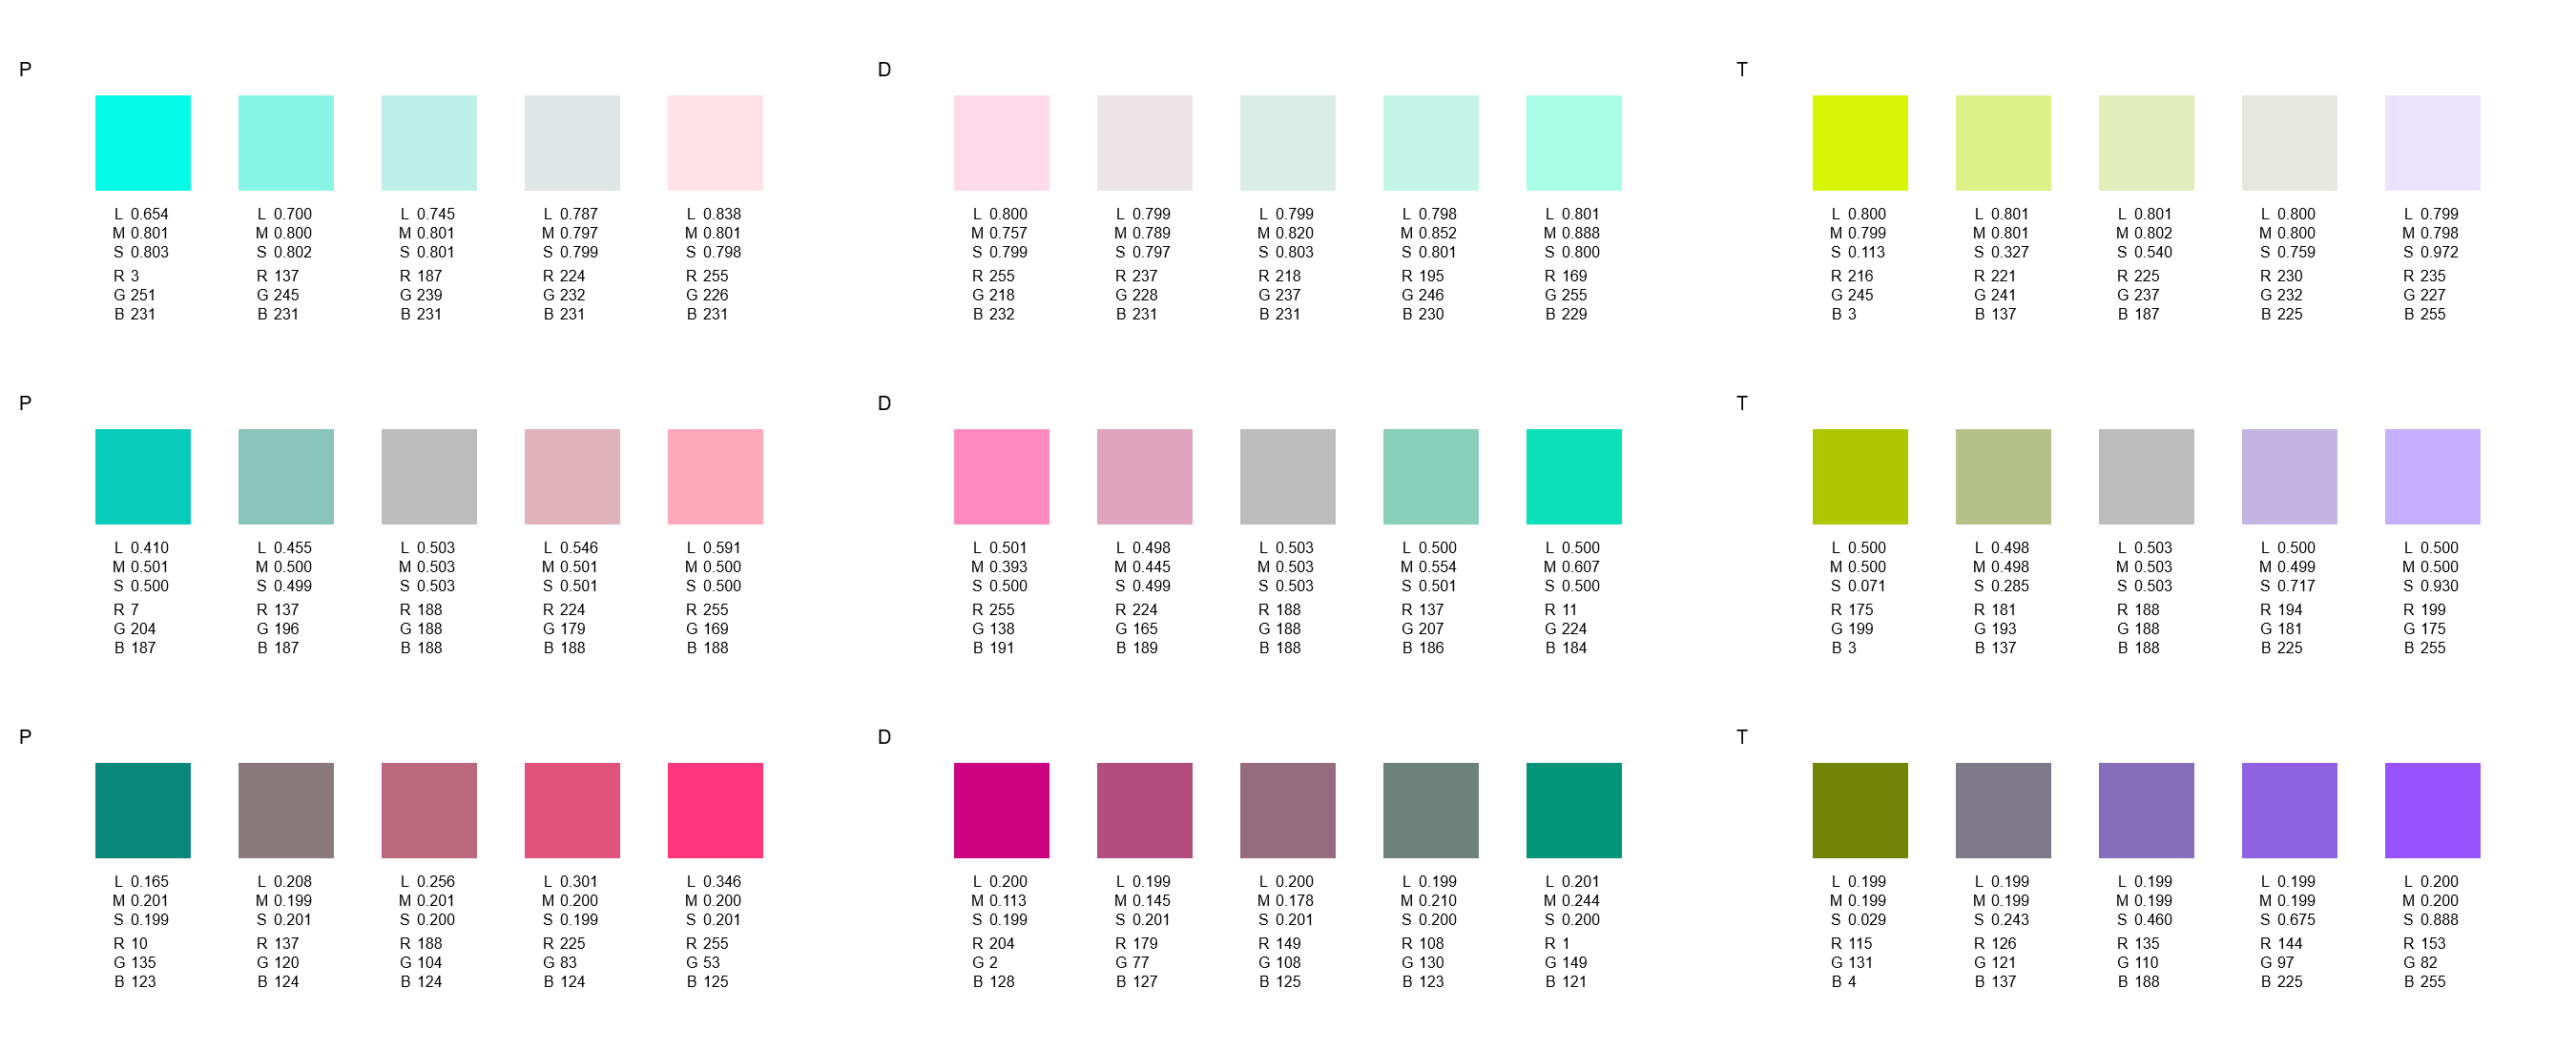
Color charts of color confusion loci for P-type dichromacy
| M = 0.8, S = 0.2 | M = 0.8, S = 0.5 | M = 0.8, S = 0.8 |
| M = 0.5, S = 0.2 | M = 0.5, S = 0.5 | M = 0.5, S = 0.8 |
| M = 0.2, S = 0.2 | M = 0.2, S = 0.5 | M = 0.2, S = 0.8 |
Color charts of color confusion loci for D-type dichromacy
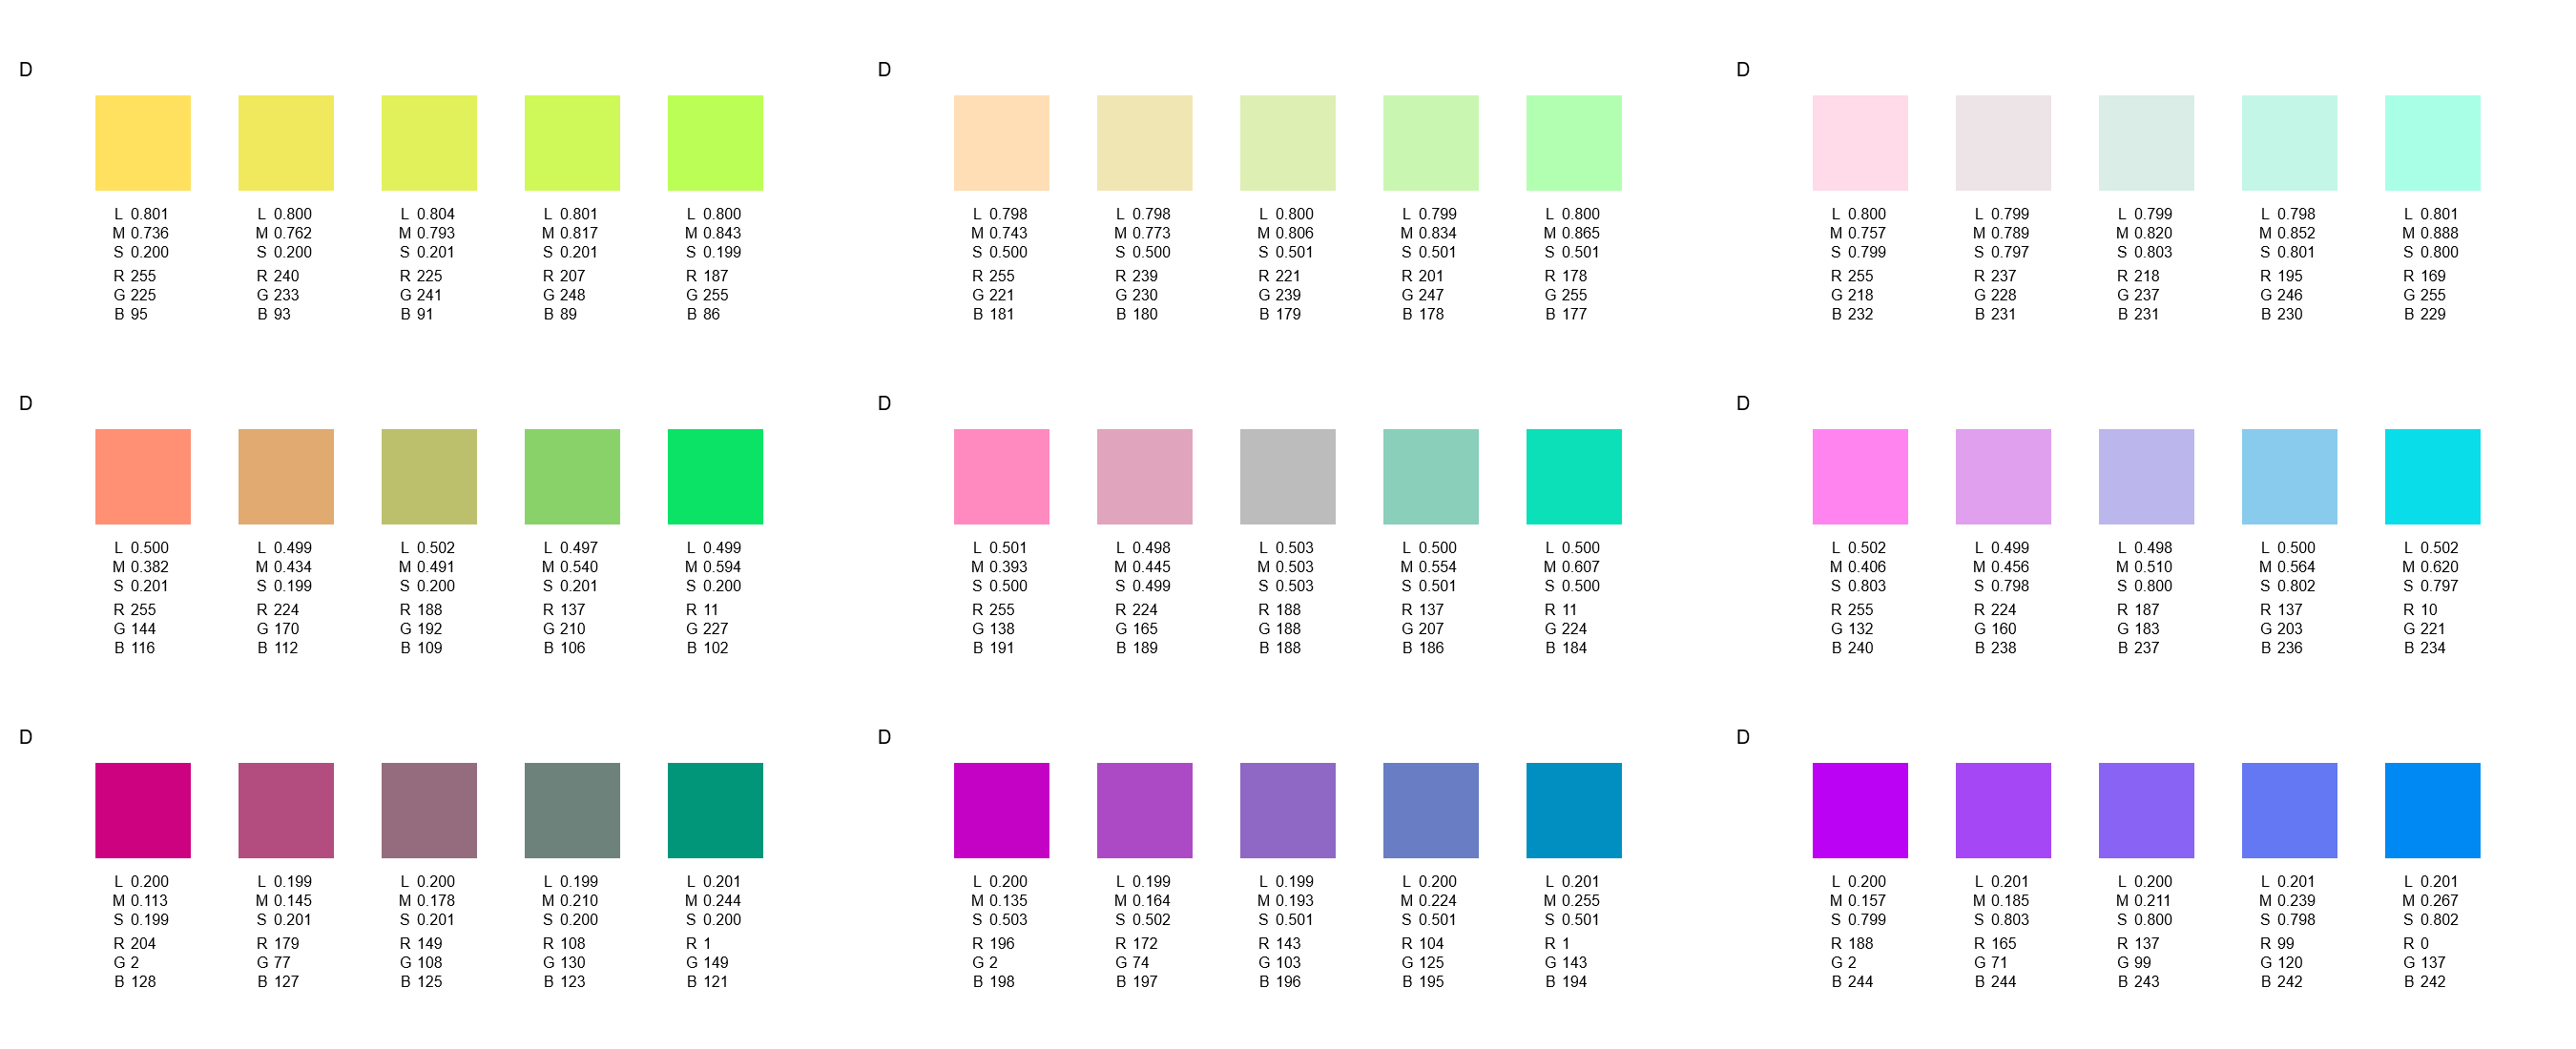
| L = 0.8, S = 0.2 | L = 0.8, S = 0.5 | L = 0.8, S = 0.8 |
| L = 0.5, S = 0.2 | L = 0.5, S = 0.5 | L = 0.5, S = 0.8 |
| L = 0.2, S = 0.2 | L = 0.2, S = 0.5 | L = 0.2, S = 0.8 |
Color charts of color confusion loci for T-type dichromacy
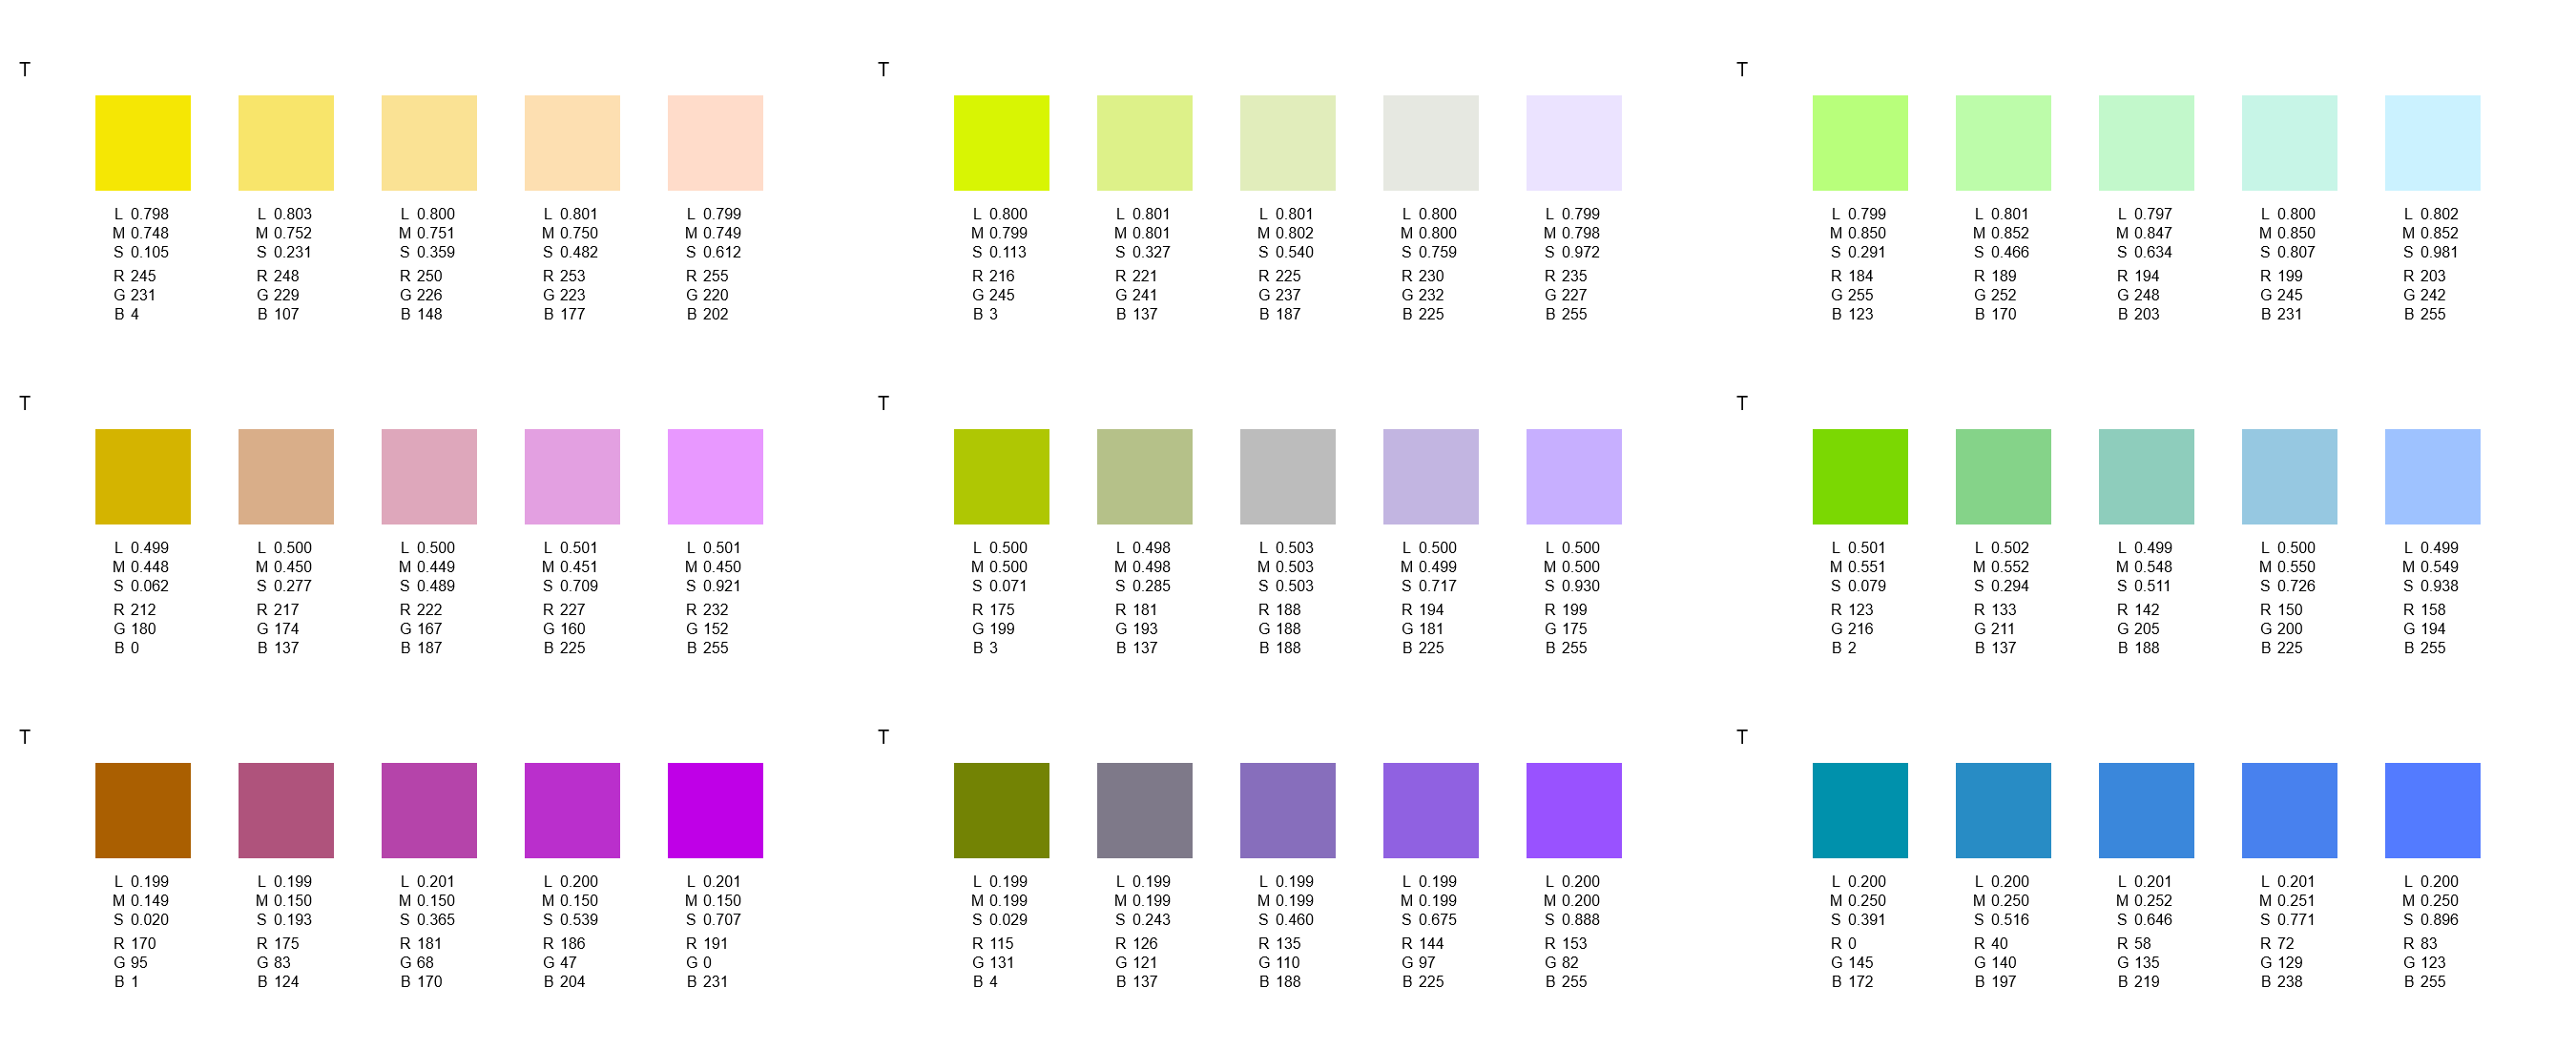
| L = 0.80, M = 0.75 | L = 0.80, M = 0.80 | L = 0.80, M = 0.85 |
| L = 0.50, M = 0.45 | L = 0.50, M = 0.50 | L = 0.50, M = 0.55 |
| L = 0.20, M = 0.15 | L = 0.20, M = 0.20 | L = 0.20, M = 0.25 |
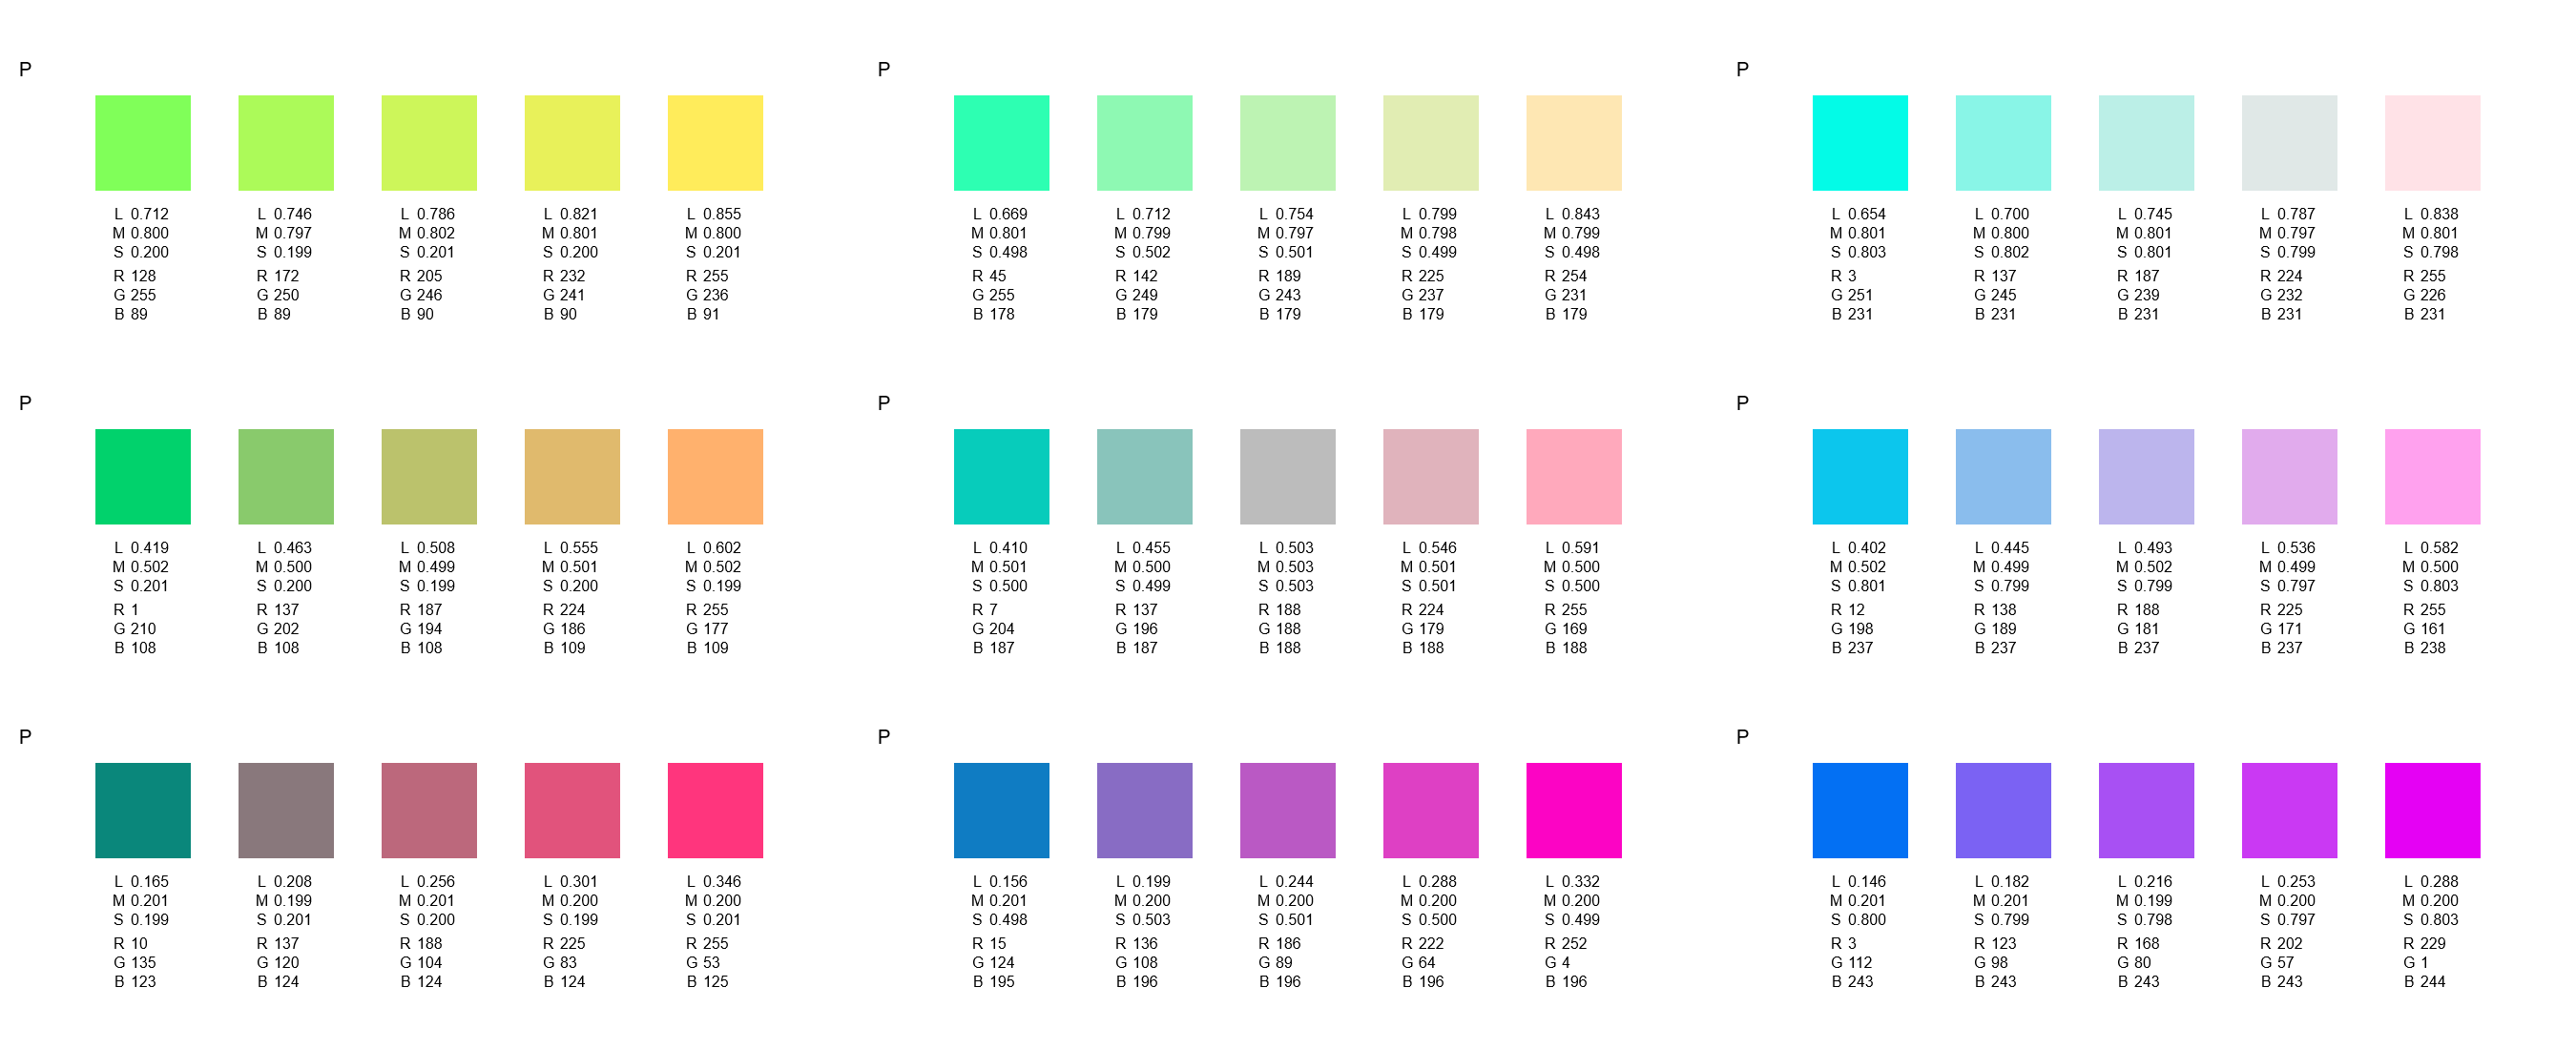
Color charts of gray confusion loci for P-, D-, and T-type dichromacy