立命館大学 総合心理学部 学部ポータル 人間科学研究科 SPSS入門

モデルの選択


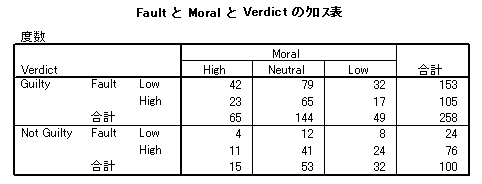
以下のようなクロス集計表 (Howell, 2002, p. 673) を考えてみます。Moral と Fault は犠牲者の特性です。一方,Verdict は被告に対する判決です。ですから,関心は犠牲者の特性と判決との間の関連性にあります。

階層的線型対数モデルとして考えられるのは,飽和モデルを除けば 17個のモデルです。

  1. ln μijk = λ + λF
  2. ln μijk = λ + λM
  3. ln μijk = λ + λV
  4. ln μijk = λ + λF + λM
  5. ln μijk = λ + λF + λV
  6. ln μijk = λ + λM + λV
  7. ln μijk = λ + λF + λM + λFM
  8. ln μijk = λ + λF + λV + λFV
  9. ln μijk = λ + λM + λV + λMV
  10. ln μijk = λ + λF + λM + λV
  11. ln μijk = λ + λF + λM + λV + λFM
  12. ln μijk = λ + λF + λM + λV + λFV
  13. ln μijk = λ + λF + λM + λV + λMV
  14. ln μijk = λ + λF + λM + λV + λFM + λFV
  15. ln μijk = λ + λF + λM + λV + λFM + λMV
  16. ln μijk = λ + λF + λM + λV + λFV + λMV
  17. ln μijk = λ + λF + λM + λV + λFM + λFV + λMV
  18. ln μijk = λ + λF + λM + λV + λFM + λFV + λMV + λFMV (飽和モデル)

λF,λM,λV はそれぞれ Fault,Moral,Verdict をそれぞれ表す。λFM は Fault × Moral を,λFV は Fault × Verdict を,λMV は Moral × Verdict をそれぞれ表す。λFMV は Fault × Moral × Verdict を表す。

モデルの当てはめでは,飽和モデルから出発します。モデルに含まれる効果を取り除いた場合,適合度の変化が有意でなければ,その効果をモデルから除きます。適合度が変化が有意であれば,その効果をモデルに残します。
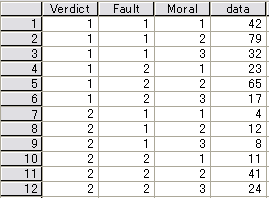
  1. 集計結果を SPSS のデータシートに入力します。


  2. メニューのデータからケースの重み付けを選択し,data を度数変数とします。


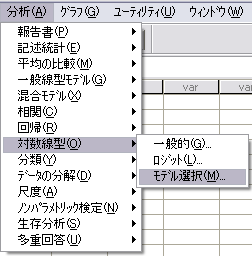
  3. メニューの分析から対数線型のモデル選択を選びます。


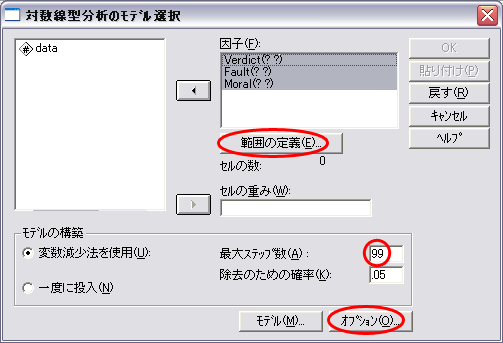
  4. Verdict,Fault,Moral を因子欄に入れます。最大ステップ数は分析が途中で終了しないように,できるだけ大きな数を設定するほうが良いでしょう。


  5. 範囲の定義をクリックして最小値と最大値を入力します。Verdict と Fault は 1 と 2,Moral は 1 から 3 までです。


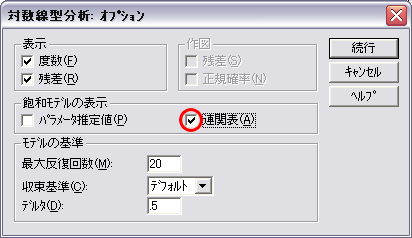
  6. 対数線型分析のモデル選択でオプションをクリックし,連関表にクリックを入れます。


  7. 最初に,飽和モデルの結果が出力されます。飽和モデルでは,期待度数が 0 になることを避けるために,すべてのセルに 0.5 を加えて処理しています。この 0.5 はデルタと呼ばれるパラメータの値です。

  8. * * * * * * * * H I E R A R C H I C A L L O G L I N E A R * * * * * * * *

    DATA Information

    12 unweighted cases accepted.
    0 cases rejected because of out-of-range factor values.
    0 cases rejected because of missing data.
    358 weighted cases will be used in the analysis.

    FACTOR Information

    Factor Level Label
    Verdict 2
    Fault 2
    Moral 3

    - - - - - - - - - - - - - - - - - - - - - - - - - - - - - - - - - - - - - - - -

    DESIGN 1 has generating class

    Verdict*Fault*Moral

    Note: For saturated models .500 has been added to all observed cells. This value may be changed by using the CRITERIA = DELTA subcommand.

    The Iterative Proportional Fit algorithm converged at iteration 1. The maximum difference between observed and fitted marginal totals is .000 and the convergence criterion is .250

    - - - - - - - - - - - - - - - - - - - - - - - - - - - - - - - - - - - - - - - -

    Observed, Expected Frequencies and Residuals.

    Factor Code OBS count EXP count Residual Std Resid
    Verdict 1
    Fault 1
    Moral 1 42.5 42.5 .00 .00
    Moral 2 79.5 79.5 .00 .00
    Moral 3 32.5 32.5 .00 .00
    Fault 2
    Moral 1 23.5 23.5 .00 .00
    Moral 2 65.5 65.5 .00 .00
    Moral 3 17.5 17.5 .00 .00
    Verdict 2
    Fault 1
    Moral 1 4.5 4.5 .00 .00
    Moral 2 12.5 12.5 .00 .00
    Moral 3 8.5 8.5 .00 .00
    Fault 2
    Moral 1 11.5 11.5 .00 .00
    Moral 2 41.5 41.5 .00 .00
    Moral 3 24.5 24.5 .00 .00

    - - - - - - - - - - - - - - - - - - - - - - - - - - - - - - - - - - - - - - - -

    Goodness-of-fit test statistics

    Likelihood ratio chi square = .00000 DF = 0 P = .
    Pearson chi square = .00000 DF = 0 P = .


    飽和モデルとデータは一致しますから,カイ二乗値は 0 になります。

  9. 3要因の交互作用,2要因以上の交互作用,1要因以上の効果について,それぞれの検定結果が表示されます。続いて,3要因の交互作用,2要因の交互作用,1要因の効果について,それぞれの検定結果が表示されます。48.931-.255 = 48.675 という関係になっています。

    Tests that K-way and higher order effects are zero.
    K DF L.R. Chisq Prob Pearson Chisq Prob Iteration
    3 2 .255 .8801 .255 .8801 3
    2 7 48.931 .0000 49.025 .0000 2
    1 11 191.920 .0000 200.905 .0000 0

    - - - - - - - - - - - - - - - - - - - - - - - - - - - - - - - - - - - - - - - -

    Tests that K-way effects are zero.

    K DF L.R. Chisq Prob Pearson Chisq Prob Iteration
    1 4 142.990 .0000 151.880 .0000 0
    2 5 48.675 .0000 48.769 .0000 0
    3 2 .255 .8801 .255 .8801 0


  10. 各要因とそれらの交互作用について,検定結果が表示されます。

    Tests of PARTIAL associations.

    Effect Name DF Partial Chisq Prob Iter
    Verdict*Fault 1 36.990 .0000 2
    Verdict*Moral 2 8.406 .0149 2
    Fault*Moral 2 2.556 .2786 2
    Verdict 1 72.193 .0000 2
    Fault 1 .045 .8326 2
    Moral 2 70.752 .0000 2


  11. まず,Veridict × Fault × Moral がモデルから除かれます。続いて,Falut × Moral がモデルから除かれます。Verdict × Fault と Verdict × Moral が最終的に残りました。

    - - - - - - - - - - - - - - - - - - - - - - - - - - - - - - - - - - - - - - - -

    Backward Elimination (p = .050) for DESIGN 1 with generating class

    Verdict*Fault*Moral

    Likelihood ratio chi square = .00000 DF = 0 P = .

    - - - - - - - - - - - - - - - - - - - - - - - - - - - - - - - - - - - - - - - -

    If Deleted Simple Effect is DF Partial Chisq Prob Iter
    Verdict*Fault*Moral 2 .255 .8801 3

    Step 1

    The best model has generating class

    Verdict*Fault
    Verdict*Moral
    Fault*Moral

    Likelihood ratio chi square = .25546 DF = 2 P = .880

    - - - - - - - - - - - - - - - - - - - - - - - - - - - - - - - - - - - - - - - -

    If Deleted Simple Effect is DF Partial Chisq Prob Iter
    Verdict*Fault 1 36.990 .0000 2
    Verdict*Moral 1 8.406 .0149 2
    Fault*Moral 2 2.556 .2786 2

    Step 2

    The best model has generating class

    Verdict*Fault
    Verdict*Moral

    Likelihood ratio chi square = 2.81175 DF = 4 P = .590

    - - - - - - - - - - - - - - - - - - - - - - - - - - - - - - - - - - - - - - - -

    If Deleted Simple Effect is DF Partial Chisq Prob Iter
    Verdict*Fault 1 37.351 .0000 2
    Verdict*Moral 2 8.768 .0125 2

    Step 3

    The best model has generating class

    Verdict*Fault
    Verdict*Moral

    Likelihood ratio chi square = 2.81175 DF = 4 P = .590


  12. Verdict × Fault と Verdict × Moral を含むモデルが選択されました。階層的対数線型モデルなので,Verdict,Fault,Moral もモデルに含まれています。

    - - - - - - - - - - - - - - - - - - - - - - - - - - - - - - - - - - - - - - - -

    The final model has generating class

    Verdict*Fault
    Verdict*Moral

    The Iterative Proportional Fit algorithm converged at iteration 0. The maximum difference between observed and fitted marginal totals is .000 and the convergence criterion is .250

    - - - - - - - - - - - - - - - - - - - - - - - - - - - - - - - - - - - - - - - -

    Observed, Expected Frequencies and Residuals.

    Factor Code OBS count EXP count Residual Std Resid
    Verdict 1
    Fault 1
    Moral 1 42.0 38.5 3.45 .56
    Moral 2 79.0 85.4 -6.40 -.69
    Moral 3 32.0 29.1 2.94 .55
    Fault 2
    Moral 1 23.0 26.5 -3.45 -.67
    Moral 2 65.0 58.6 6.40 .84
    Moral 3 17.0 19.9 -2.94 -.66
    Verdict 2
    Fault 1
    Moral 1 4.0 3.6 .40 .21
    Moral 2 12.0 12.7 -.72 -.20
    Moral 3 8.0 7.7 .32 .12
    Fault 2
    Moral 1 11.0 11.4 -.40 -.12
    Moral 2 41.0 40.3 .72 .11
    Moral 3 24.0 24.3 -.32 -.06

    - - - - - - - - - - - - - - - - - - - - - - - - - - - - - - - - - - - - - - - -

    Goodness-of-fit test statistics

    Likelihood ratio chi square = 2.81175 DF = 4 P = .590
    Pearson chi square = 2.79859 DF = 4 P = .592

    - - - - - - - - - - - - - - - - - - - - - - - - - - - - - - - - - - - - - - - -


    選択されたモデルの適合度は,尤度比とピアソンのどちらのカイ二乗値も 2.8 です。自由度はともに 4 です。モデルの期待度数と観察度数との間に有意な不一致がみられません。